1. Introduction
Real world asset or “RWA” projects are the hottest thing in the crypto-asset markets right now. So, when one of the world’s largest RWA projects, Mantra, saw its token drop by over 90% in the span of a few hours, foul play was immediately suspected.
Rumors started flying immediately, alleging insiders had dumped Mantra’s OM token on unsuspecting retail investors, even as market makers were blamed for the OM’s precipitous price collapse.
In this case study we look at the blow-by-blow of OM’s staggering fall from the darling token of RWA projects, to the derided, sifting through conjecture, and concentrating only on blockchain transaction data.
One of the biggest challenges in analyzing blockchain transaction data is attributing wallet addresses with entities or individuals. In the case of Mantra, both market makers and insiders denied that the wallets which sent significant sums of OM to exchanges to be sold belonged to them.
The issue of course is that linking blockchain transactions with off-chain activities is challenging at best, and impossible at worst, with attribution of wallet addresses continuing to be educated guesswork in many cases.
2. What is Mantra and the OM token?
Mantra presents itself as the decentralized finance (DeFi) solution for real world assets (RWAs). A Layer 1 blockchain, akin to Ethereum and Bitcoin, Mantra purports to provide a secure and compliant decentralized blockchain solution for the tokenization of RWAs.
The OM token is intended to serve as the utility and governance token for the Mantra blockchain network.
With the recent interest in RWAs and the tokenization of both financial and non-financial assets, Mantra’s OM token soared in value, hitting a high of over US$8 on February 22, 2025, representing a 300x increase from its 2024 lows.
The Mantra OM Token Price Collapse
On April 13, 2025, the OM token fell by as much as 90% over the span of a few hours, triggering speculation of a “rug pull” by insiders. At the time this case study was prepared, OM was trading at just below US$0.50.
Let’s start by examining the hourly transaction behavior of OM tokens in the run-up to the price collapse. It’s clear from Figure 1. that at around 6.00 pm UTC on April 13, there was a sudden flurry of activity. While the sums transferred were significantly larger than usual (“Sum of Transfer Amounts”) the “Number of Transfers” far outstripped the amounts transferred.
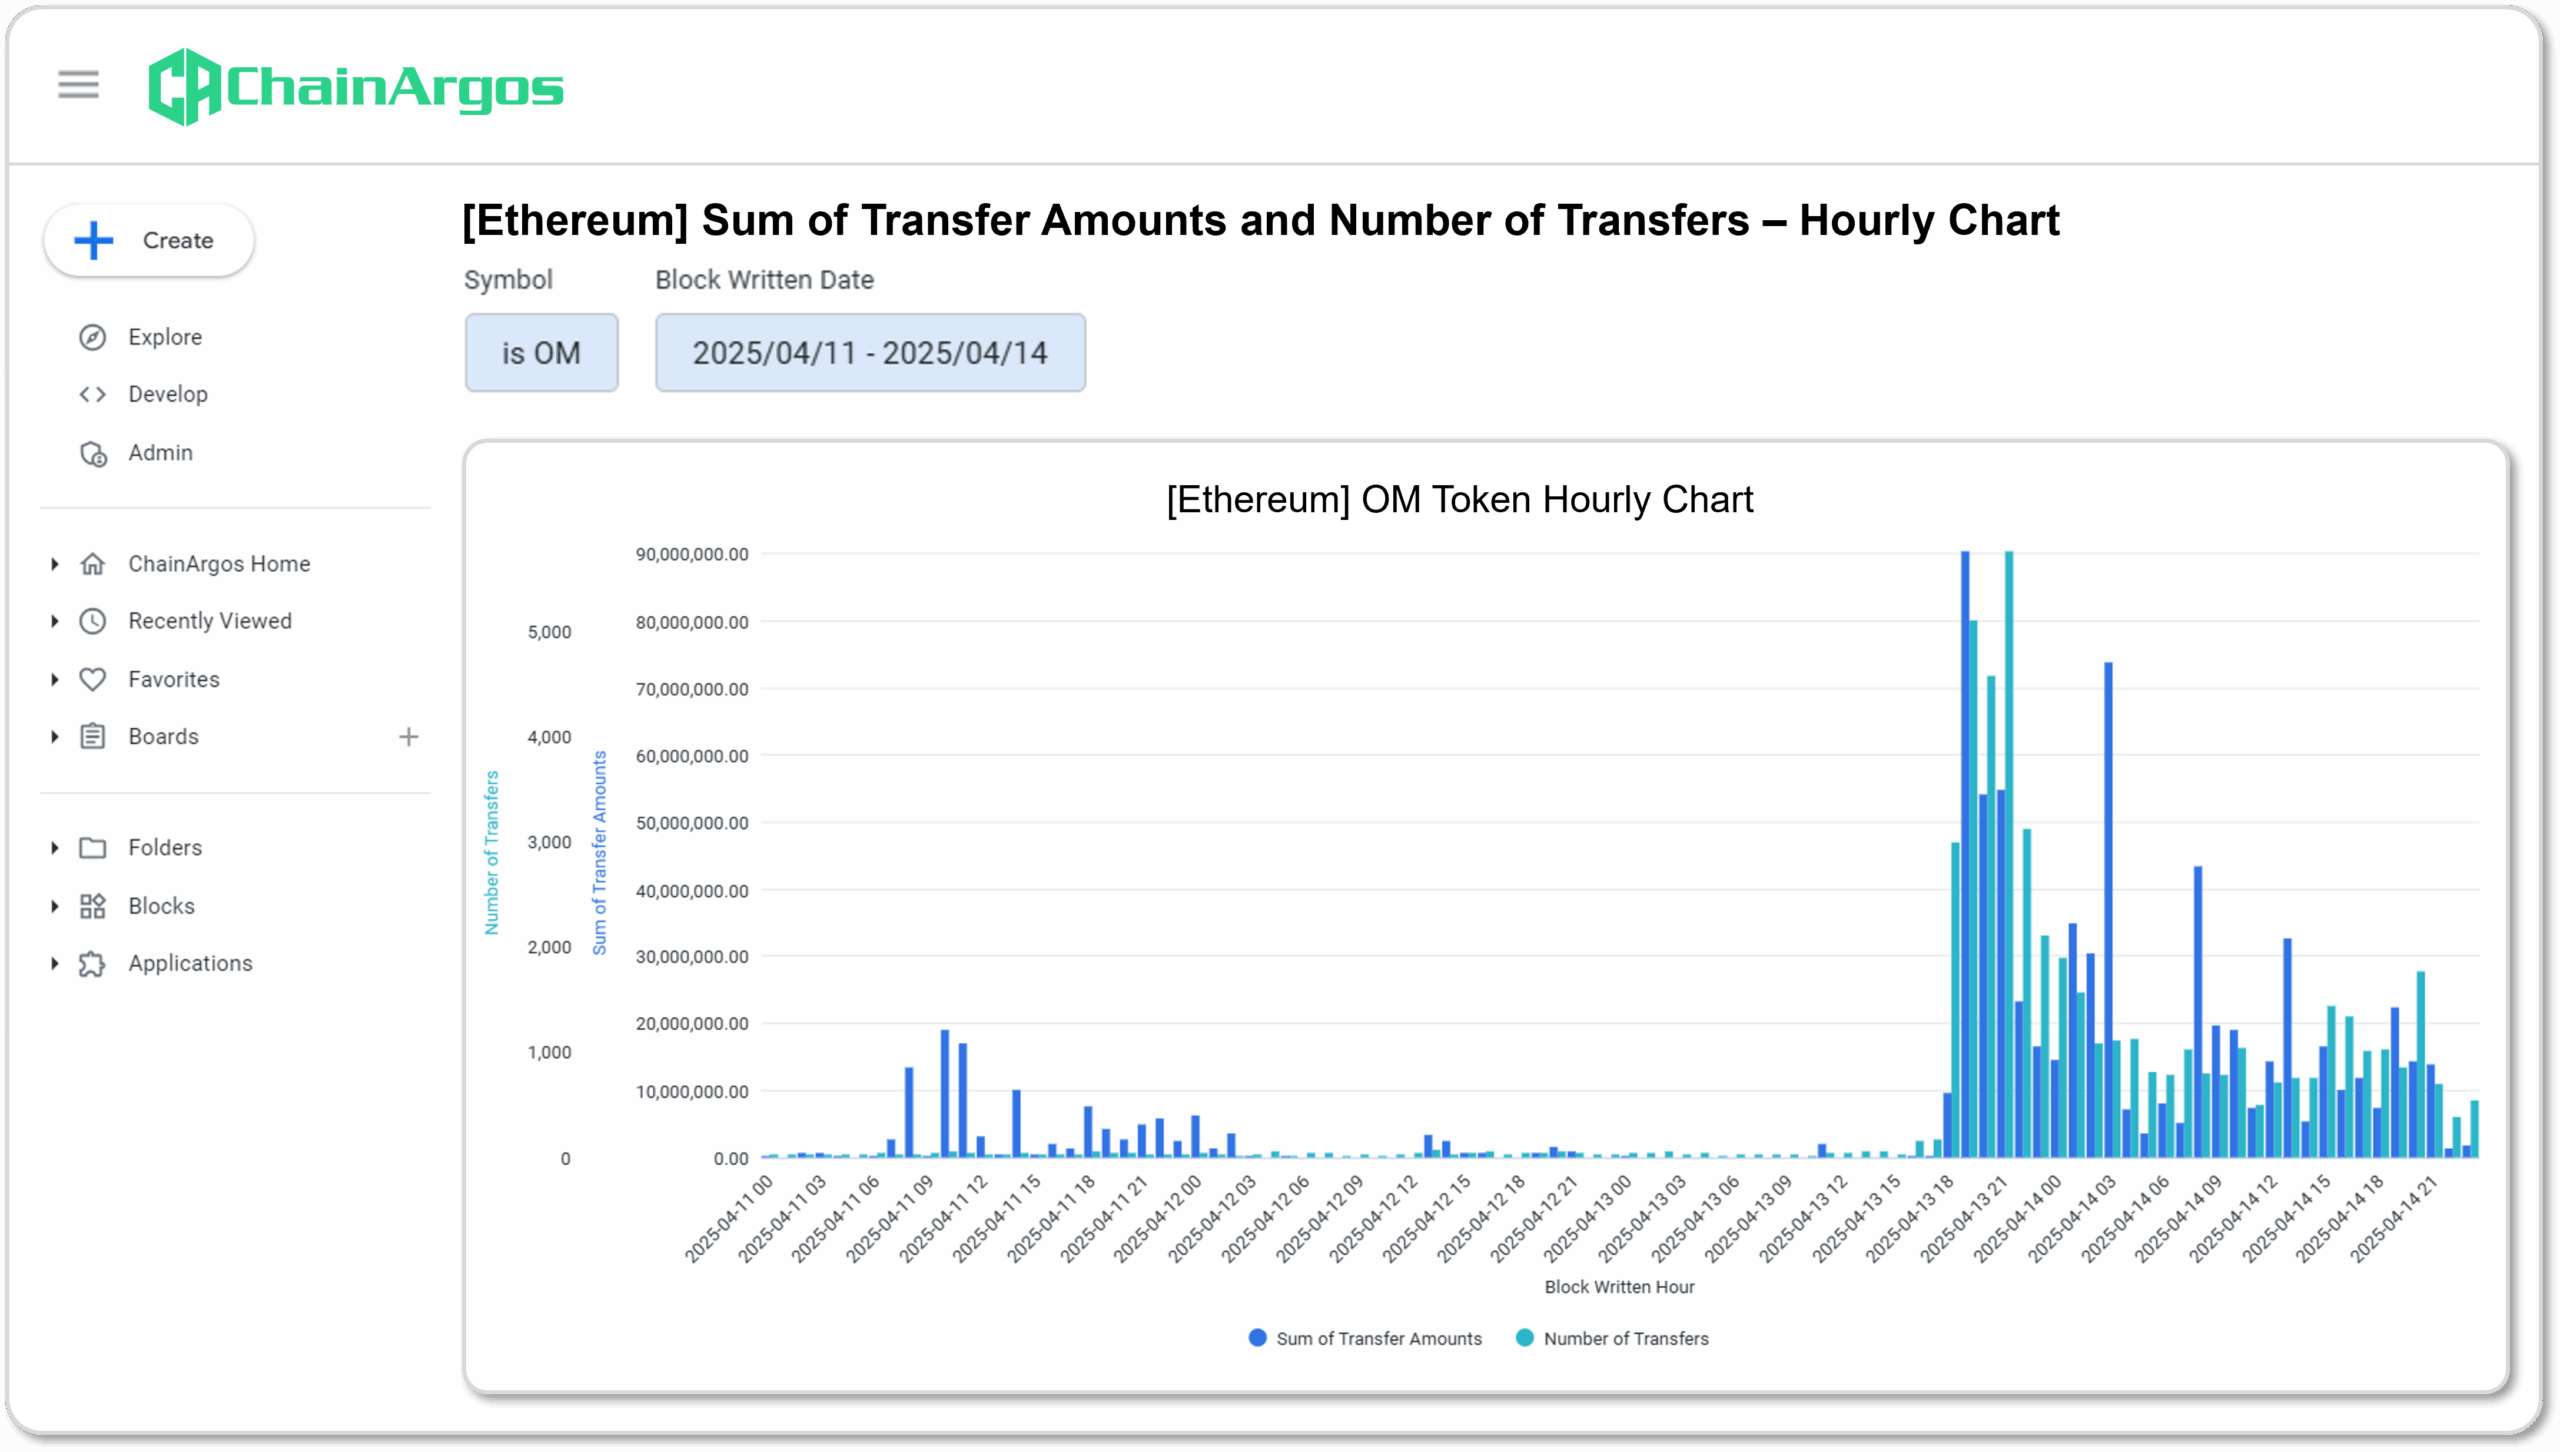
Figure 1. OM token hourly transaction activity in the run-up to the April 13, 2025 crash. Note the sudden uptick in Sum of Transfer Amounts and the Number of Transfers on the hourly chart.
The “Sum of Transfer Amounts” refers to the amounts of the OM token that were transferred, and the “Number of Transfers” means literally the count of transfers of OM tokens.
If the “Sum of Transfer Amounts” is large and the “Number of Transfers” is very low, this typically indicates that whales are moving volume.
Whereas when the “Sum of Transfer Amounts” is proportionately smaller than the “Number of Transfers” it indicates that a large number of small transfers has taken place.
Because of more complex obfuscation techniques, although the hourly chart shows us that large volumes of OM token were being moved, and that this activity kicked off at 6.00 pm UTC on April 13, 2025, it’s not entirely clear it was large holders of OM tokens moving these sums looking at the hourly chart alone.
While unlikely, it’s entirely possible that a coordinated effort by many disparate participants was made to send OM tokens to various exchanges for sale. That level of coordination between individual actors is not unheard of (e.g. Telegram pump and dump groups), but would be challenging to execute with precision on this scale.
Instead, it is far more common for a large number of wallet addresses, controlled or associated with a handful of collaborators, to be sending tokens in each of those many wallets to exchanges.
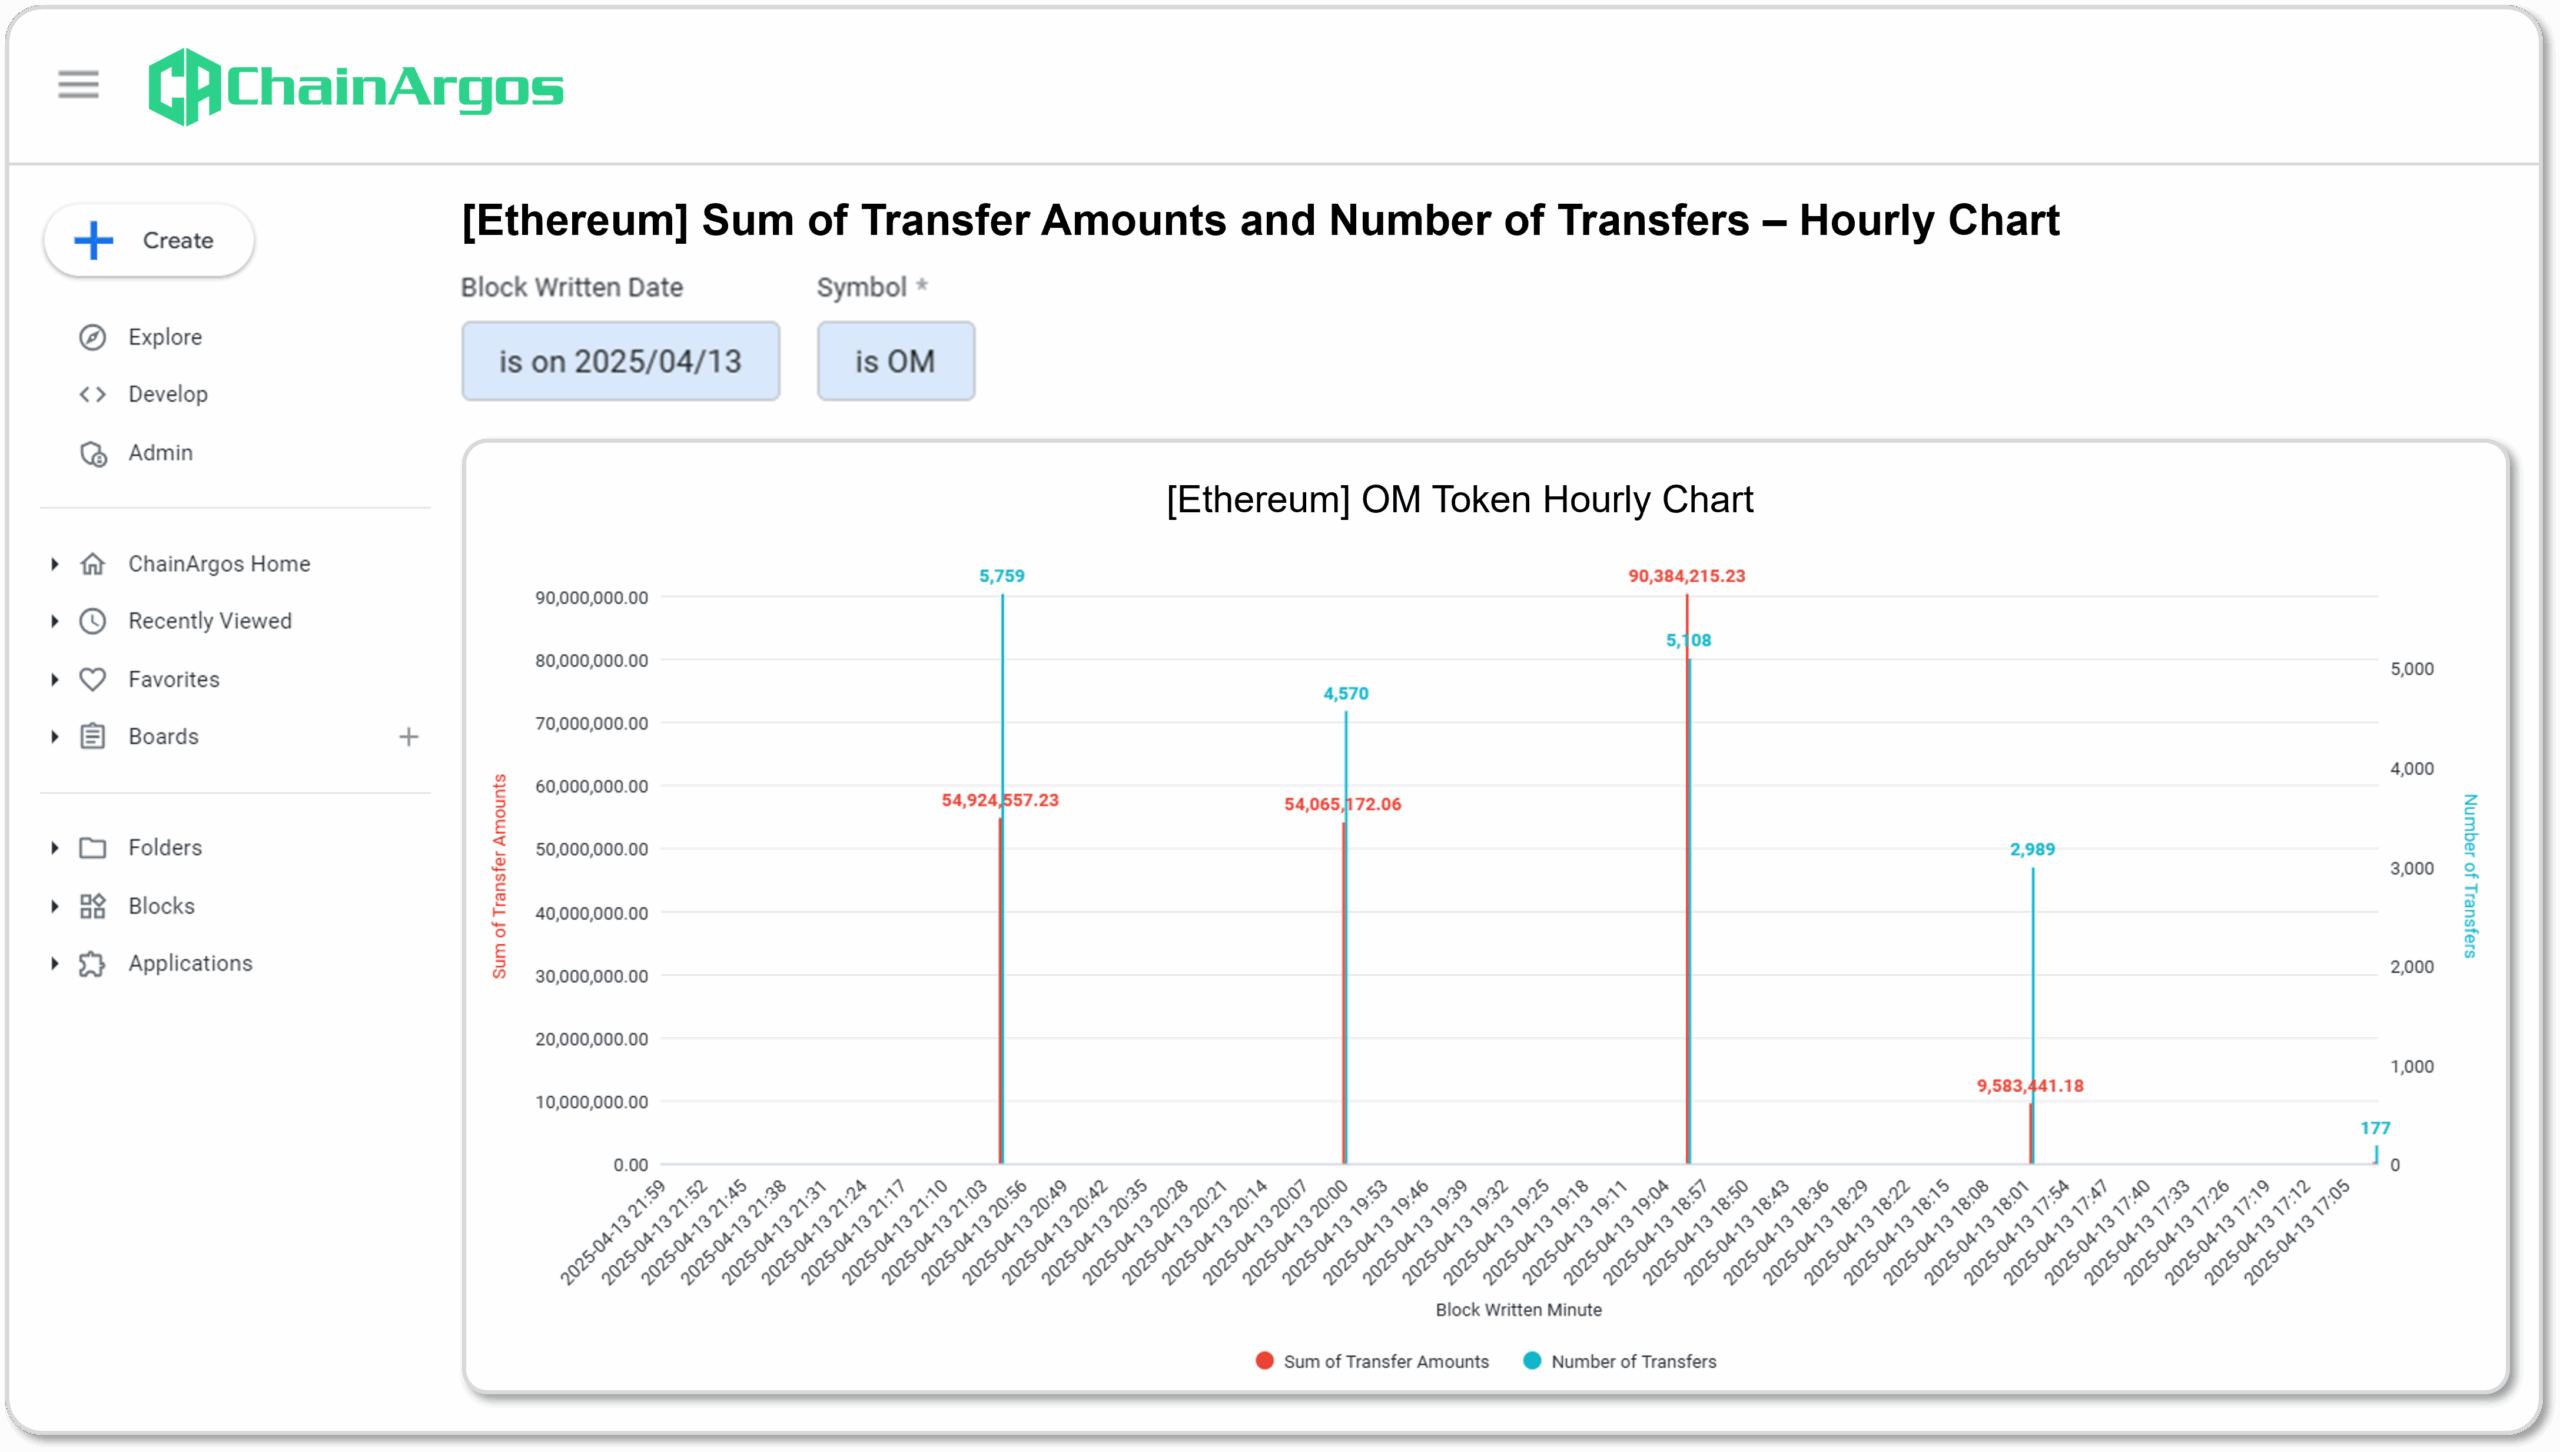
Figure 2. Sum of Transfer Amounts and Number of Transfers for the OM token on April 13, 2025. Note the one at 8.00 pm UTC and the other at 9.00 pm UTC which over the course of the hour were for the exact same amounts, despite there being a different number of transfers.
Notice how in Figure 2., the “Sum of Transfer Amounts” in the first two major transaction spikes was almost equal for those specific periods, approximately 54 million OM tokens were sent, even though the “Number of Transfers” was different.
While this could be pure coincidence, it more likely suggests some coordination or joint control over those transactions because it would be difficult otherwise to explain away how the total amounts for those two hours were almost exactly the same.
Imagine if the goal is to send a dollar to someone, you could send it in a single transaction of $1 or ten transactions of 10 cents. While the economic substance of both transactions is the same, the interpretation of both transactions could be dramatically different.
Next, let’s examine where all these tokens were moving to or from.
Although wallet addresses associated with Binance and OKX have been identified as the primary recipients of OM tokens on April 13, 2025, FalconX, a major crypto-asset broker, was not.
In Figure 3., we can see that both FalconX and what appears to be a FalconX customer, were major movers during the period the OM token price collapsed.
The FalconX wallet at Line 2 sent approximately 33.3 million OM tokens on April 13, 2025 while the FalconX deposit address at Line 6 moved almost 10 million.
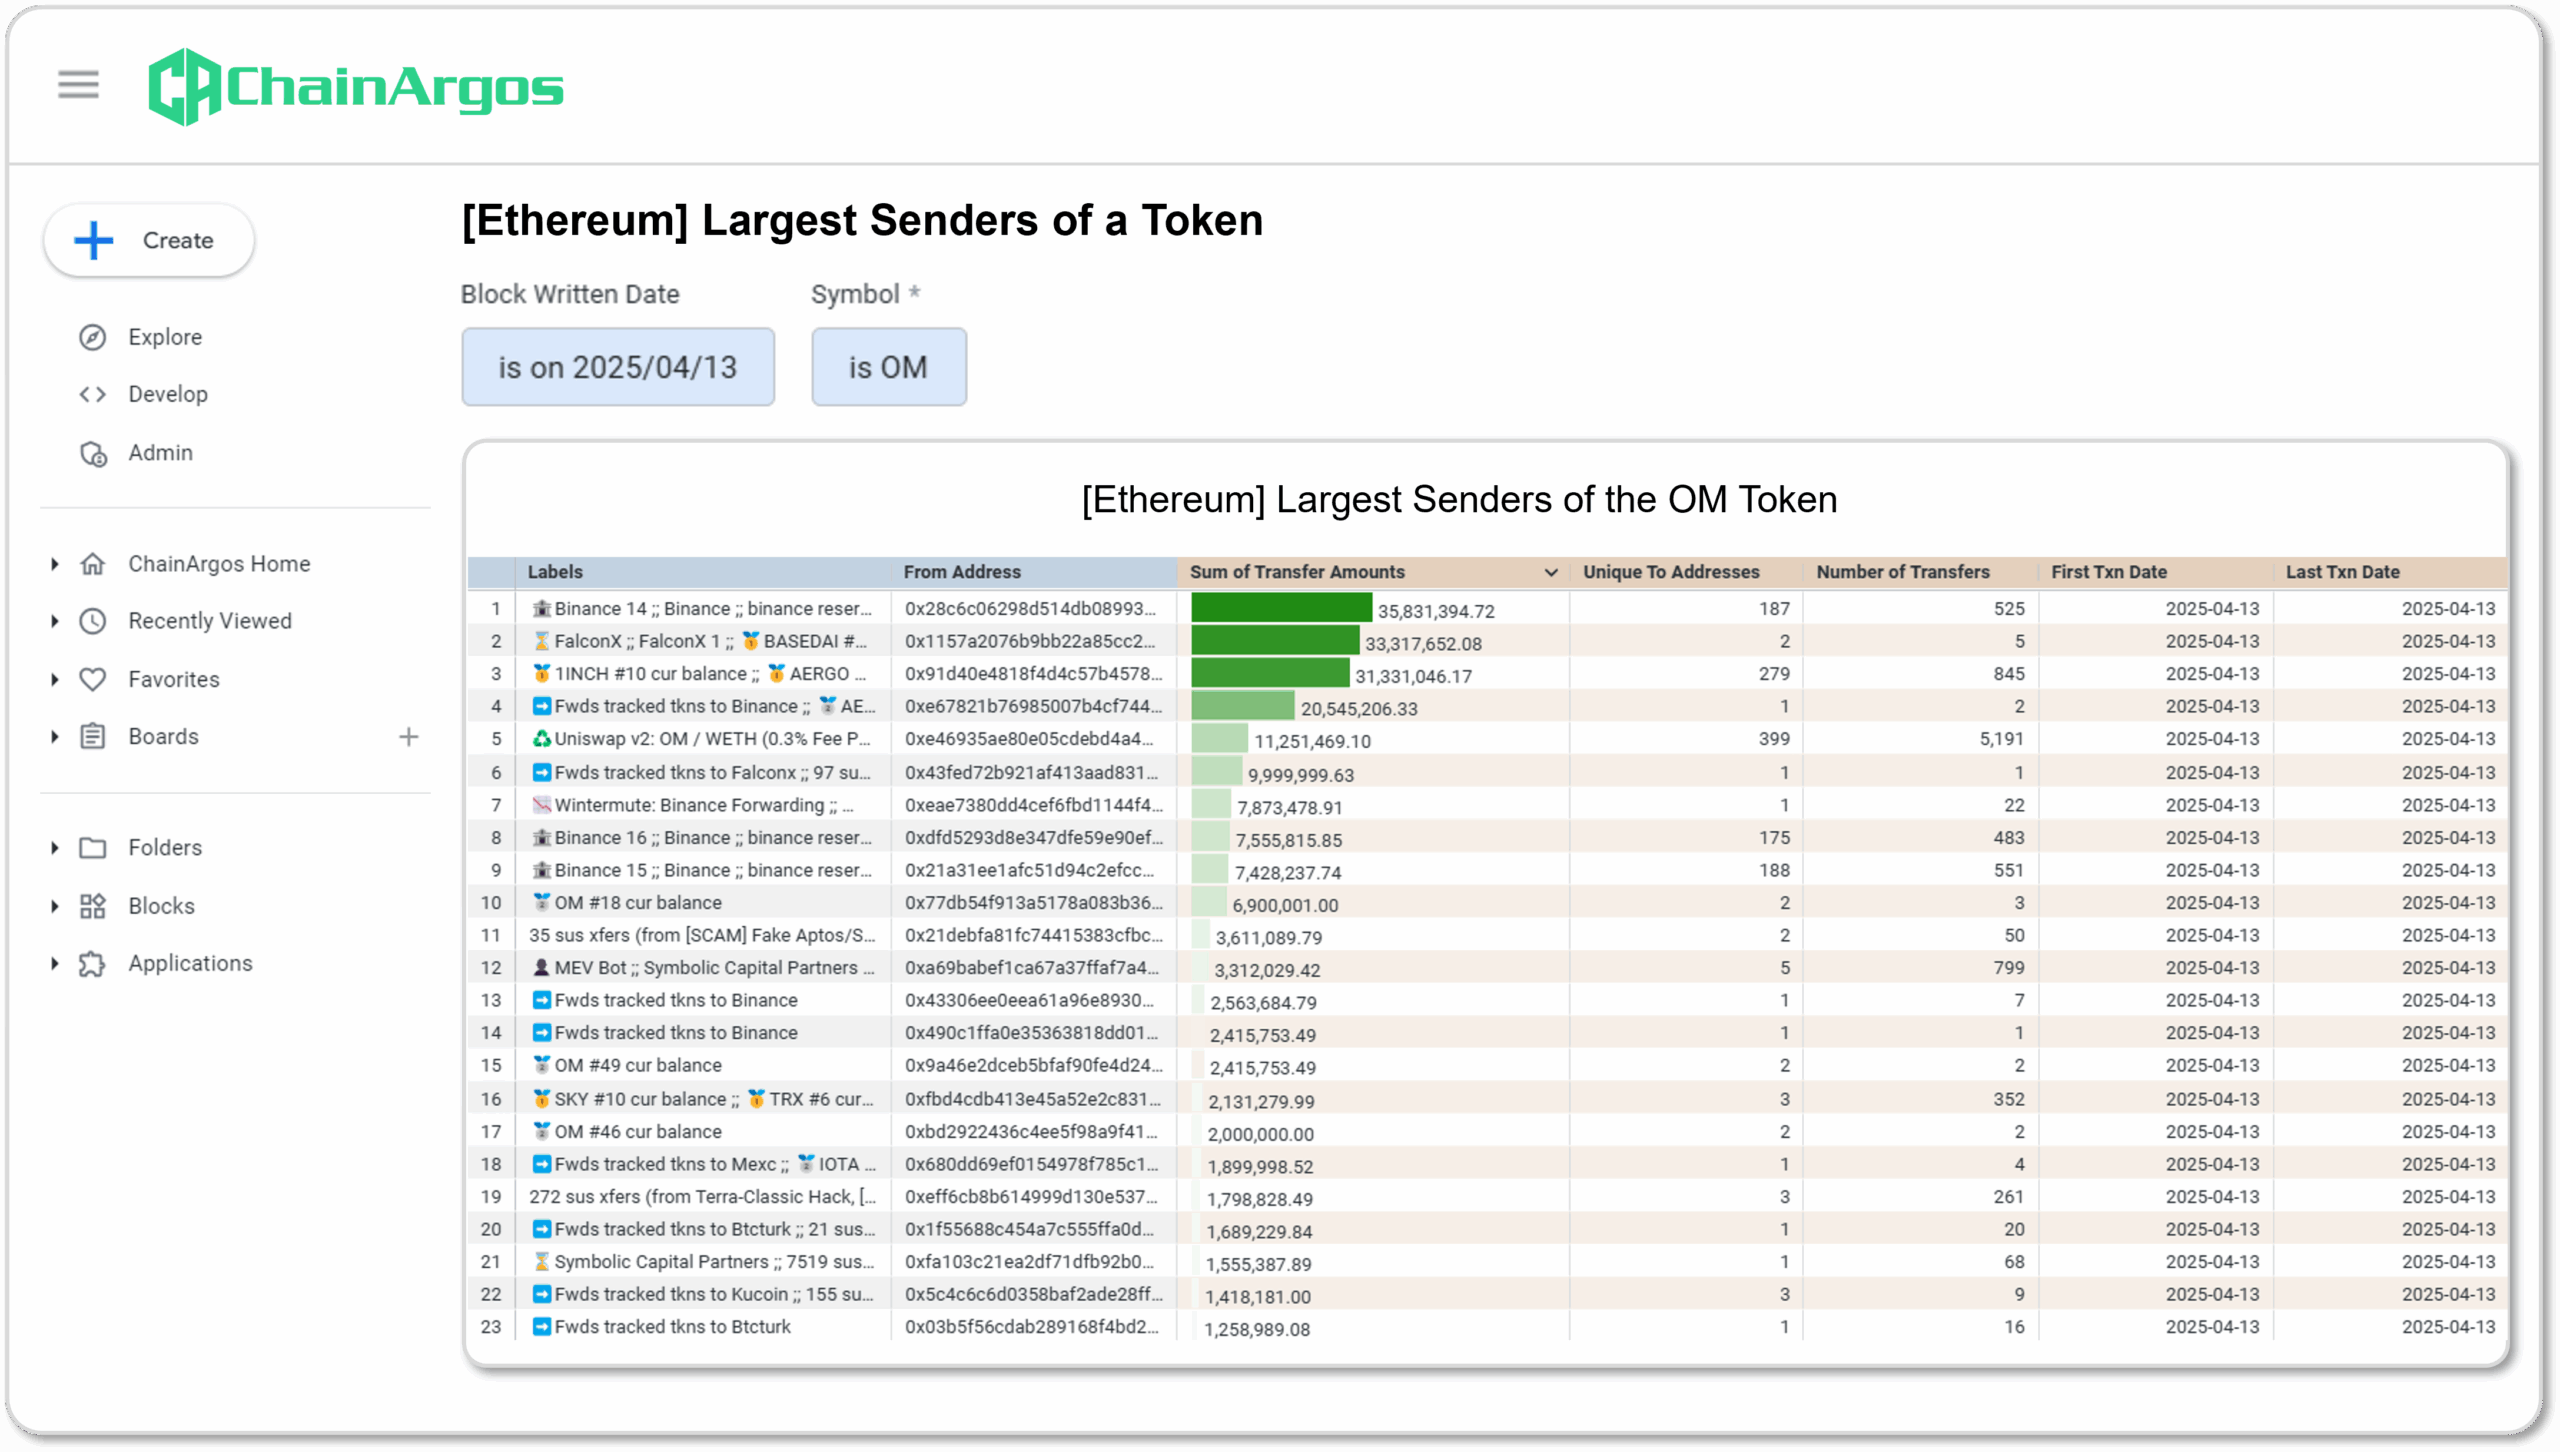
Figure 3. Largest Senders of the OM token on April 13, 2025.
ChainArgos identifies customer deposit addresses, such as the address in Line 6, which is labeled as “➡️Fwds tracked tkns to Falconx” by automatically tagging the wallet address based on its transaction behavior.
Where an address only ever forwards monitored tokens to a known or identified entity’s address (e.g. a cold wallet), that address is labeled as “➡️Fwds tracked tkns to”. In this case, the address in Line 6 has been identified as a FalconX customer deposit address.
Where is the Mantra team in all this?
What is perhaps worth noting is that there don’t appear to be any Mantra team wallets that directly sent OM tokens to any identified exchanges on the day OM’s price collapsed.
That is not to say insiders did not cash out their OM tokens. For instance, insiders may have had accounts at FalconX or pushed amounts of OM tokens onto exchanges such as Binance and OKX for some time, accumulating sufficient size to prepare to sell those OM tokens.
But the idea that insiders had gradually set up the “dump” of OM seems highly unlikely, given there were massive movements of OM tokens on April 13, 2025 into crypto-asset exchanges like Binance and OKX, presumably to sell those OM tokens.
In Figure 4., we see how Binance wallet and deposit addresses received some 89.6 million OM tokens worth over US$530 million (at the time), on April 13, 2025.
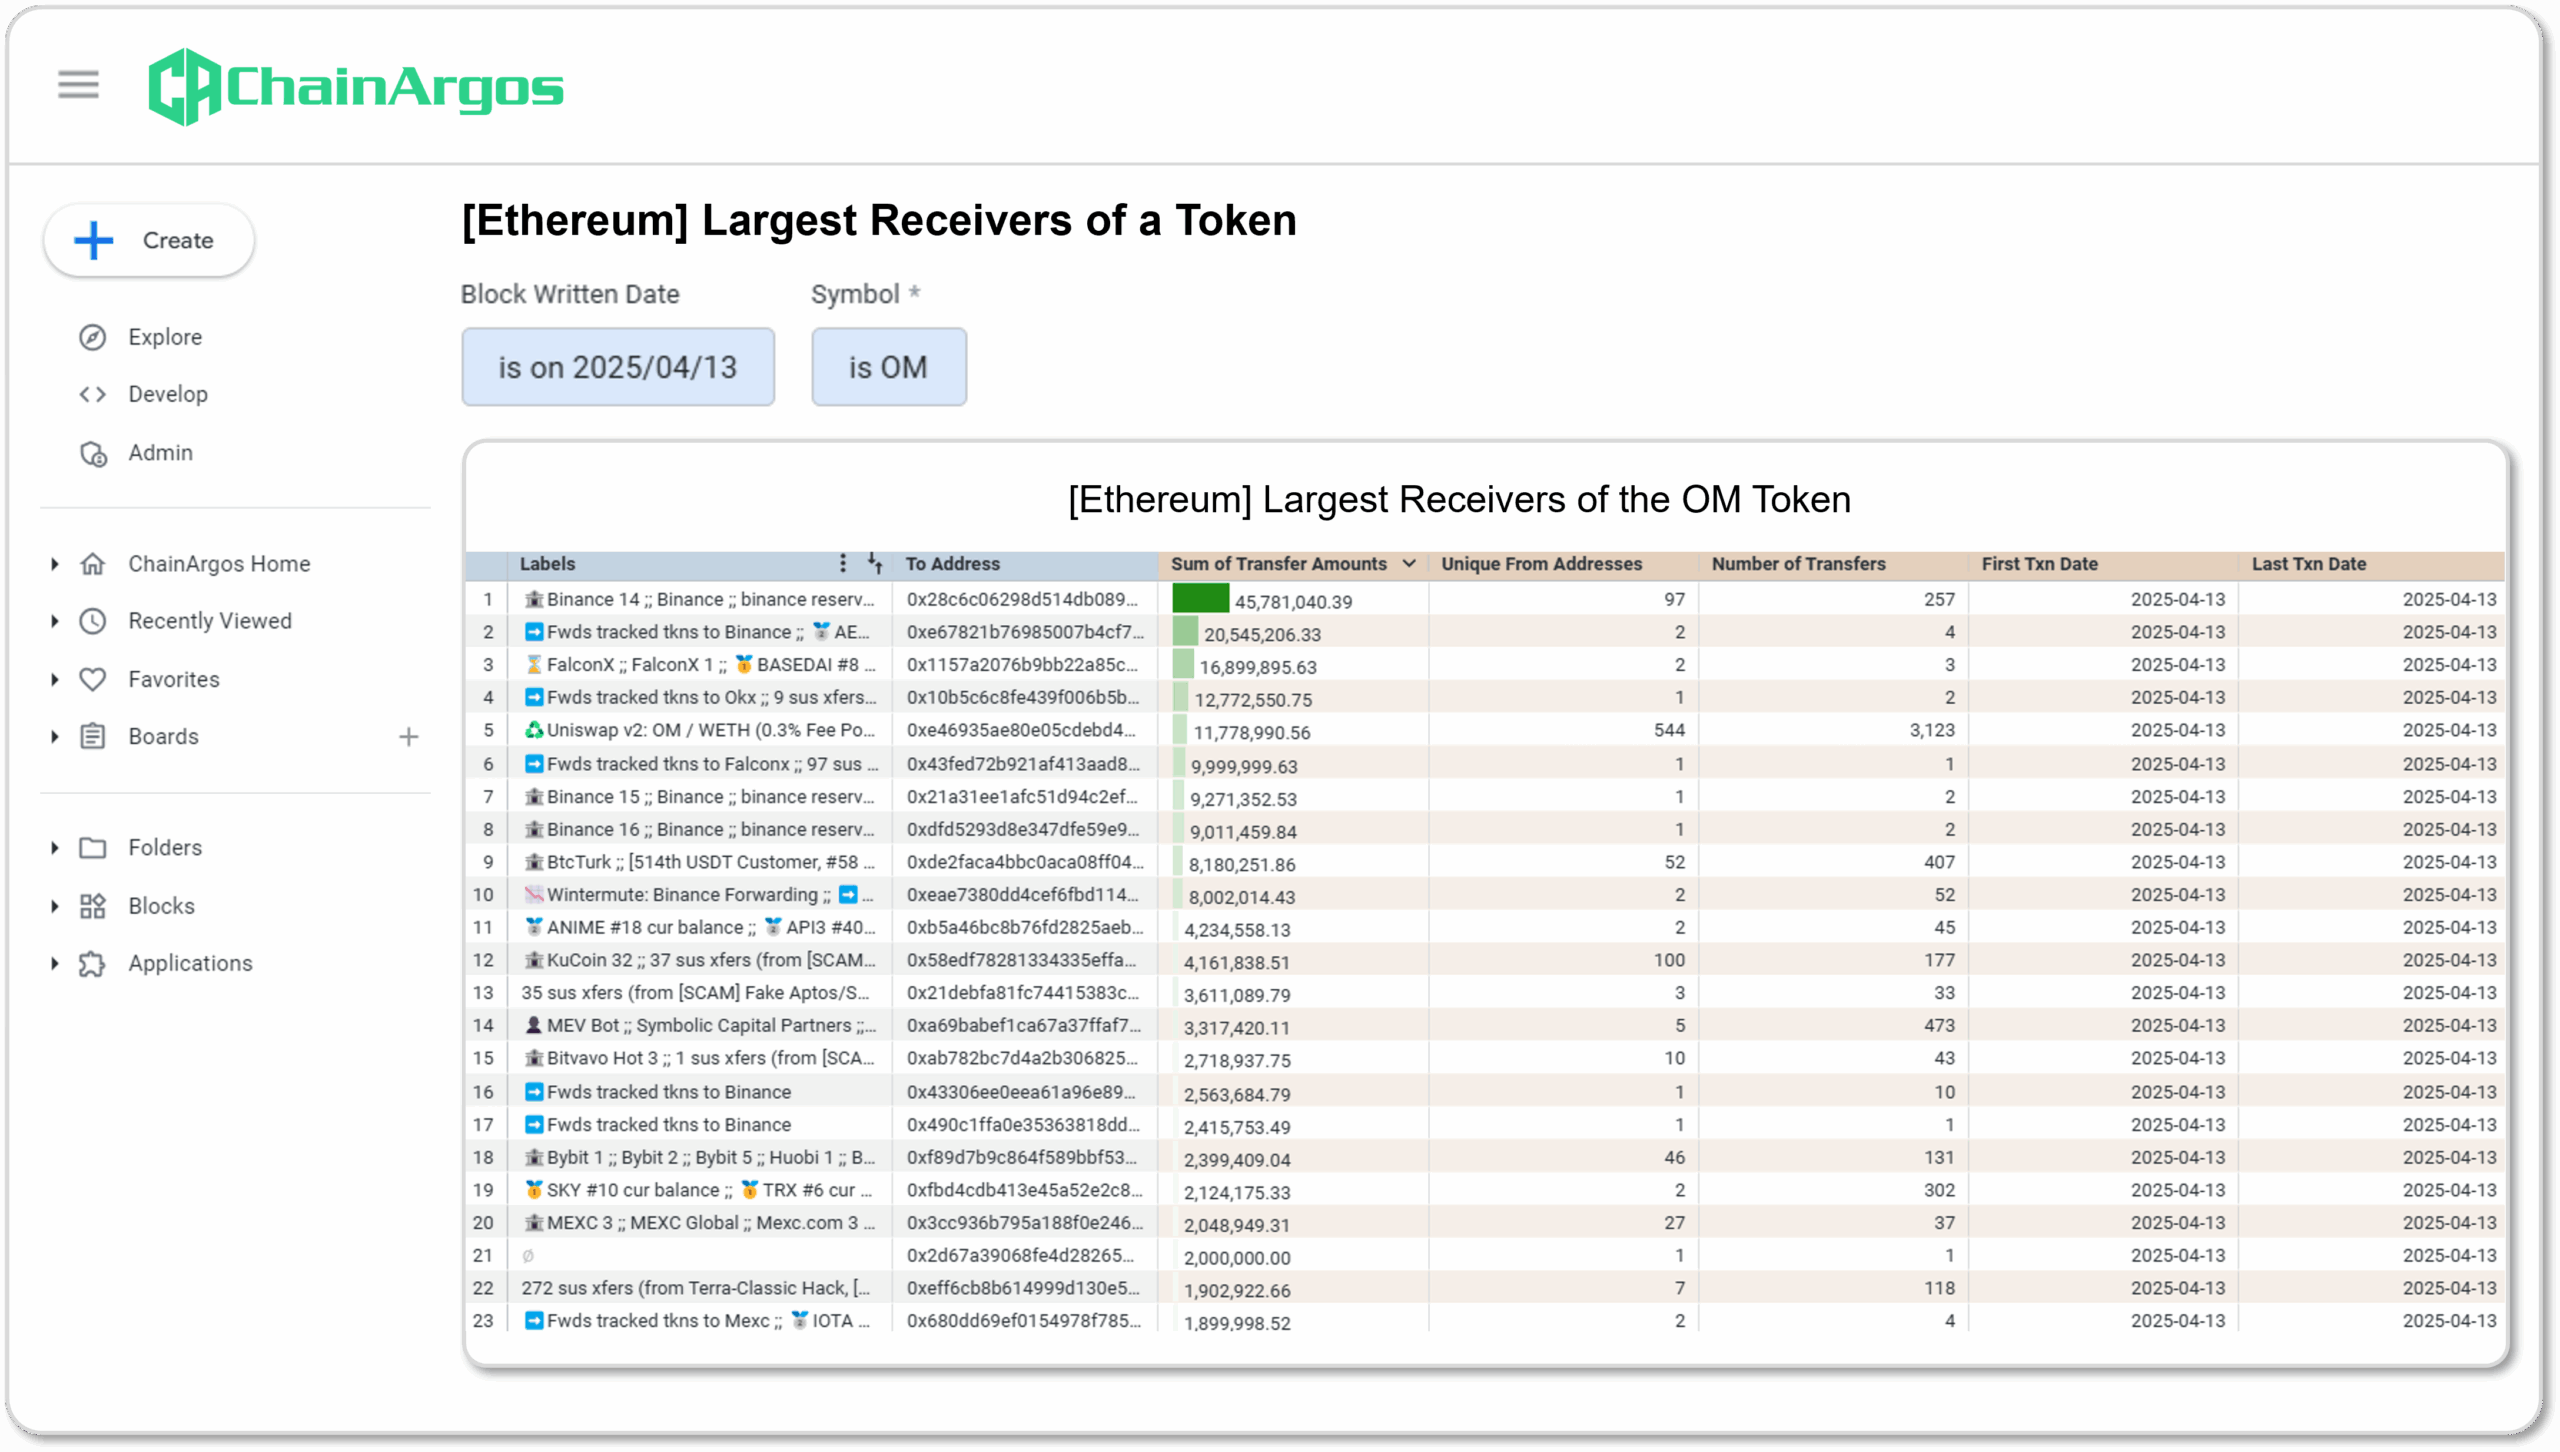
Figure 4. Largest Receivers of the OM token on April 13, 2025.
3. Analysis and Conclusion
While blockchain transaction data can certainly provide alerts that a major token movement is occurring, for instance the statistically significant surge in OM token transaction size and number of transfers, determining who was responsible for such moves is less straightforward.
There is sufficient blockchain transaction data to support the view that the OM token dump was a coordinated exercise, as evidenced by the final number of OM tokens sent, despite the varying number of transactions.
Blockchain transaction data also does not seem to suggest the Mantra team, or insiders were responsible for the OM token dump, especially given there are no clearly marked Mantra team wallets associated with significant flows of OM tokens.
Without relying on team declarations, ChainArgos automatically labels wallet addresses based on metrics such as when an address received a given token. For instance, “OM recv #2” means the address in question was only the second ever receiver of the OM token, regardless of amount. This ranking is static because it simply marks the chronological moment when a wallet receives a token.
An address which is the 2nd ever receiver of a specific token provides information on the nature of that address. (E.g. It could suggest the address was an early investor into the token, part of the founding team, closely associated with the token project, a venture capitalist, etc.)
On April 13, 2025 at least, there were no such wallets tagged as early receivers of the OM token sending OM tokens to any identified exchanges. That is not to say that the OM tokens weren’t already sitting in crypto-asset exchange deposit addresses, but at least there seems to be limited blockchain transaction evidence to support the claim that insiders were dumping OM tokens to the exchange.
For traders, the sudden surge in OM token transactions heading into crypto-asset exchanges should have alerted them that this would likely result in selling pressure.
It is also noteworthy that the OM token movements were almost entirely to centralized exchanges, brokers, or market makers, and to a far lesser extent, decentralized exchanges such as Uniswap.
On April 13, 2025, Uniswap only received some 11.7 million OM tokens, far less than the amount of OM tokens received by centralized exchanges combined.
In conclusion, blockchain transaction activity monitoring can be critical to preserving the value of your investment, but it cannot always provide irrefutable evidence as to who is responsible for those movements.
Without confirmation from exchanges, service providers, and brokers, the possibility of Mantra insiders dumping their OM tokens cannot be summarily dismissed. However, based purely on blockchain transaction data, this does not immediately appear to be an inside job.